

FlightScale User Guide

Welcome to the FlightScale User Guide. This document will help you get started using FlightScale in a hurry! Just breeze through from start to finish so you know about each Template type and will be able to choose the best one for you.
Please note that version 1.4 has changed the names of some labels in FlightScale and not all of the screenshots and descriptions here have been updated yet. I am hoping to complete the update to this entire guide soon, but in the meantime just note that some of the screenshots and label descriptions may differ from your current version. Thank you for your patience.
Sections:
Section 1 - Launch FlightScale!Section 2 - Templates
Section 3 - Simple Template
Section 4 - Advanced Template
Section 5 - Helicopter Template
Section 6 - Utility Envelope
Section 7 - Ramp, Takeoff, and Landing Fuel
Section 8 - Max Takeoff and Landing Weight
Section 9 - Non-Linear Fuel CG
Section 10 - Conclusion
Section 1. Launch FlightScale!
After downloading FlightScale from the iTunes App Store, go ahead and tap that icon! FlightScale will launch and you will be presented with the About screen of the App. This screen also has a button that will direct you back to this guide. (Note: You should not see the Cessna, Beechcraft, or MD900 saved templates in your menu when you launch the app. These are saved templates on my device.)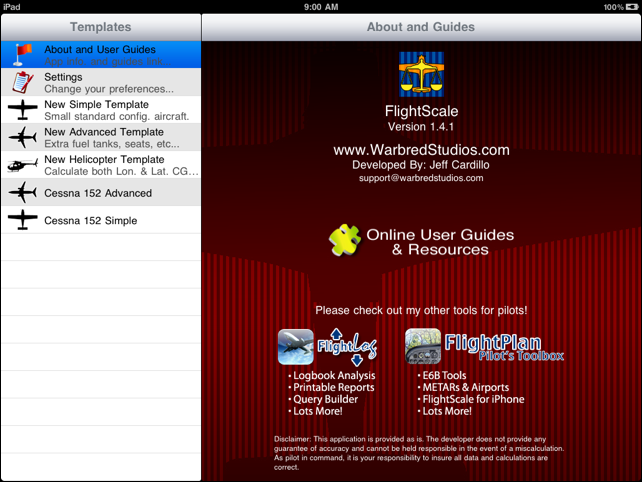
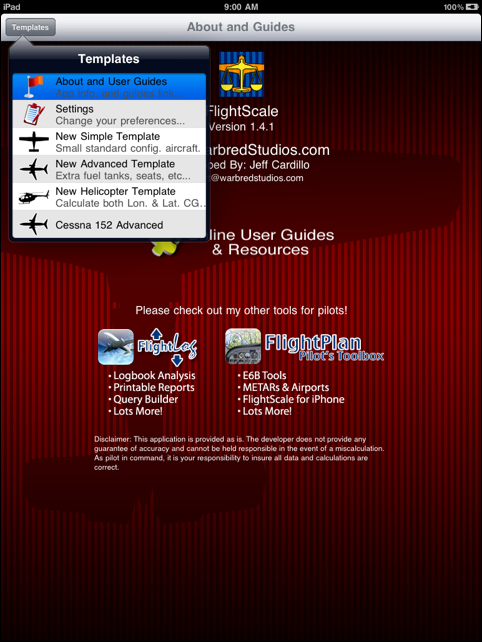
FlightScale is designed to work in any orientation you wish to hold your iPad, so get comfortable however you wish. Most of the screenshots will be presented in landscape mode since it allows the template bar to be visible on the left side and I’ll be referring to it often. Just note that in portrait mode, the same menu is available by tapping that “Templates” button on the upper left of the top toolbar.
Section 2. Templates
FlightScale is a general purpose tool meaning that it is designed to be used with just about any aircraft! This is accomplished through Templates. Templates are simply data input screens that try to make it easy for you to add your data and show you your results. Version 1.0 of FlightScale shipped with 2 templates, the Simple and Advanced templates. There will be other templates to follow, such as Helicopter templates, etc.
| Simple Template The simple template is great for small aircraft with static configurations. It provides entry spaces for up to 4 rows of seats and 1 extra “Other” category. This template will satisfy most hobbyist pilots. | |
| | Advanced Template The Advanced template allows further configurations of your aircraft by allowing any number of weight/arm entries to be added. This template is great if you have multiple fuel tanks, more rows of seats, extra baggage compartments, or other attached equipment. This template used to be called the “Moderate Template” and there may be some screenshots displayed that still show this name. |
| | Helicopter Template The helicopter template is very similar to the Advanced template but also allows the center of gravity to be calculated for lateral axis along with the longitudinal axis. |
To get started, simply tap the “New” template style you wish to enter data for. I’ll start off by showing you the “New Simple Template”.
Section 3. Simple Template
Tapping “New Simple Template” will show the below screen. Just start entering the information for your aircraft! Notice that the Oil and Fuel row let you specify the Volume of liquid you are adding. These rows will use the definition of Weight Per Volume that can be found on the Settings screen to calculate your weight or volume.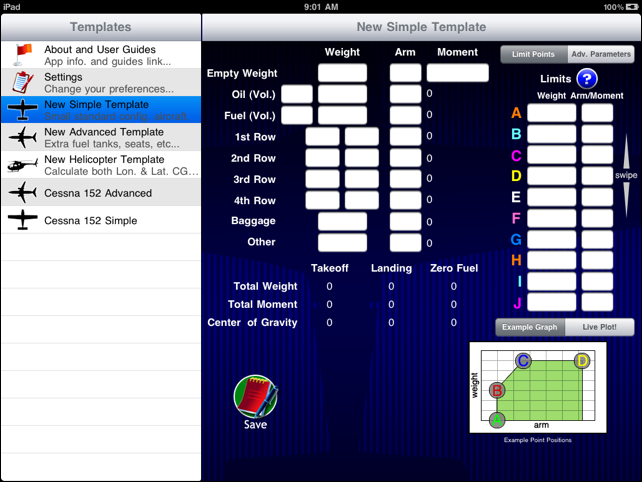
Notice that you can enter Limits data on the right of this screen under the “Limit Points” tab. The Limits will create an envelope that FlightScale will test against to see if you fall safely within. The Limits for your aircraft can be found in the Pilot’s Handbook for your aircraft. Please note that the Limits entry fields are scrollable and will allow you to entry more points than are visible on the screen. If you need more points than FlightScale can handle please contact me to let me know.
The text results at the bottom showing Total Weight and Center of Gravity will be displayed in red if you are outside of your envelope, and green if you are inside. The live plot will also show you your points for “Full Fuel” and “Zero Fuel” and how you’ll progress from one point to the other. The plot points will be displayed red/green if you are outside/inside your envelope respectively.
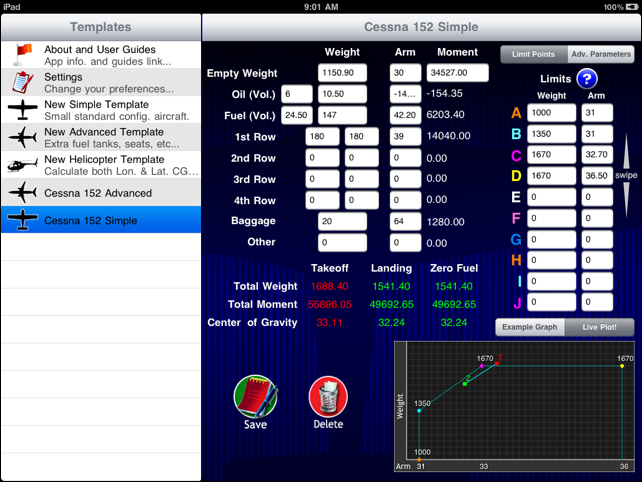
You can save your templates for later use. This way, next time you want to fly, you simply replace the few fields that have changed with updated values, such as baggage, passengers, and fuel. Your saved templates will show up on the left Templates bar and will be loaded when you tap on them. Saved templates also have a Delete button on them if you would like to discard them.
I have saved a Simple Template and it can be seen below. Notice how the result labels are colored and their correlation with the points in the plot. Note that if no landing fuel is specified then the Landing fields will be the same as the Zero Fuel fields.
Section 4. Advanced Template
Tapping “New Advanced Template” will show the below screen. This screen will need a bit more explaining than the Simple template.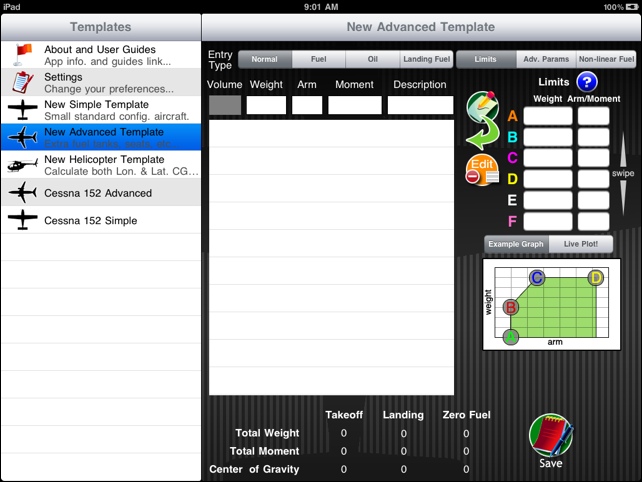
This template is designed to let you add as much data as you need. On the very top of the screen there is a “segmented control” that allows you to specify the data entry type. Normal entries consist of a Weight, Arm, Moment, and Description. You only need to provide 2 of the entry fields, such as Weight and Arm, then the Moment will fill in automatically. You also could provide the Arm and Moment, or Weight and Moment, and the missing entry will fill in automatically. Notice how Normal entries disable the Volume field.
Taping the segmented control to enter either Fuel or Oil enables the Volume field. This will use the “Weight Per Volume” definition for Fuel and Oil on the Template screen under the Advanced Parameters (“Adv. Params”) tab to calculate your weight if you provide a volume, or your volume if you provide a weight.
Try entering a Weight and Arm for a Normal entry type, then tap the button on the right of the entry row that looks like a pencil and paper. There is a green arrow on this button illustrating that you should see your entry jump to the table after you tap the button. This table will hold all of your entries. Just keep adding as many as you need! It is a good idea to give them Descriptions so that you can easily see what each entry represents.
Fill in your Limits data just like in the Simple Template. Here, there is a segmented control that is hiding your live plot until you hit “Live Plot!”. Once you have selected “Live Plot!”, your plot will always show when you look at the Advanced Template unless you switch the control back to Example Graph.
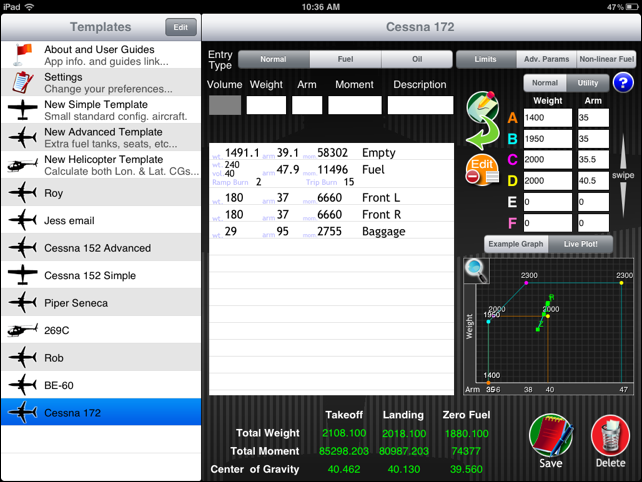
Below I have a filled out Advanced Template and have enabled the Live Plot.
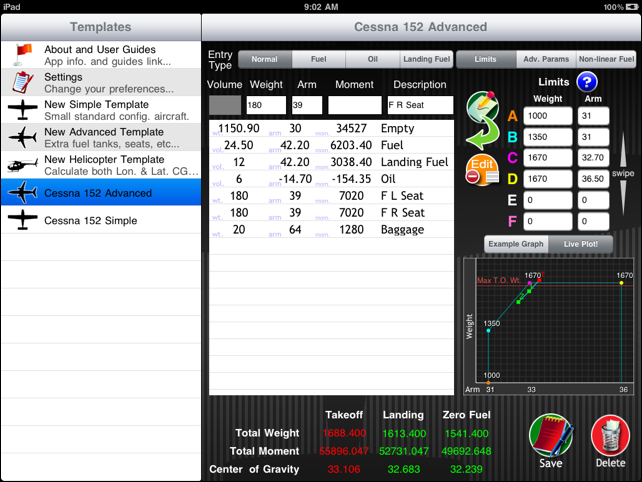
The data I have used for my Simple Template and Advanced Template is essentially the same, so you can see that either template will work well to get the job done. The plot in the Advanced Template has a different aspect ratio so it appears different, but it is plotting the same data and represents the same fuel trend.
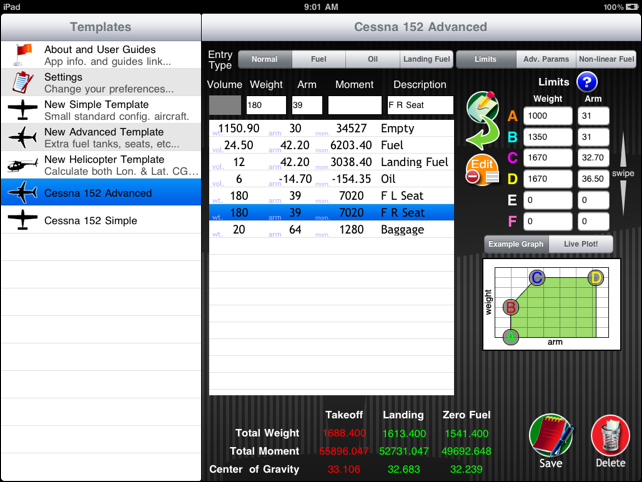
You can modify a table entry by tapping on it. The fields will fill the entry boxes and you can modify the fields. Tapping the pencil and paper button with a row selected will replace that row with the new data!
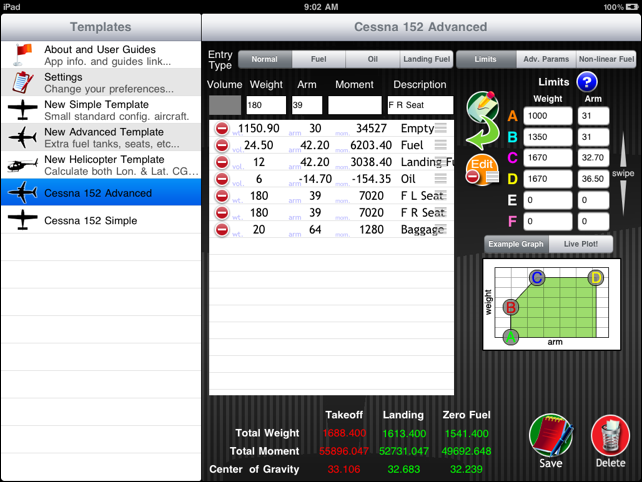
You can also reorder the table rows, or delete them completely by tapping on the Edit button next to the data table. To reorder rows, tap the Edit button, then tap and hold the 3 bars on the right side of the row you wish to move, then drag it to the position you want to move it to. To delete a row, tap the Edit button, then tap the red delete control on the left of the row, then confirm the delete by tapping the red Delete button that appears on the right side of the row.
Section 5. Helicopter Template
The Helicopter Template is very similar to the Advanced template, so for basic use of this template please be sure to review the Advanced Template section.
The Helicopter Template allows you to also specify lateral arms for each of your weight arm segments. In version 1.8 and above, you can define a lateral envelope that will be used for analysis and graphing!
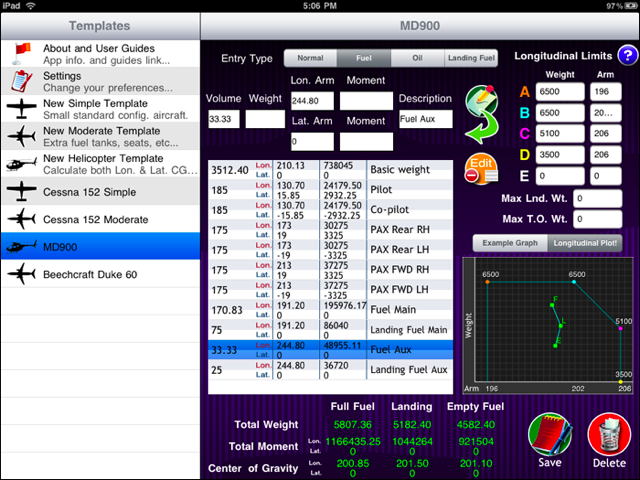
The screenshot below shows a filled out Helicopter Template.
Section 6. Utility Envelope
FlightScale now allows you to define a utility envelope for your template. Under the “Limits” tab on the right hand side you will now see 2 options, a “Normal” and a “Utility” tab. You must have a Normal envelope defined before you can define a Utility envelope, so the Utility points will be disabled and “grayed out” until the normal envelope is defined.
The Utility envelope will be drawn on your graph in orange as show here:
The Utility envelope is for visual reference only at this time. Your points on the graph are not checked against it, meaning, it will not flag you as outside of the envelope unless you are outside of the normal envelope or one of your defined boundaries.
Section 7. Ramp, Takeoff, and Landing Fuel
FlightScale now allows you to define a “Ramp Burn” and a “Trip Burn” for your templates. The ramp burn is how much fuel you burn during your taxi and run-up procedure. The trip burn is how much fuel you’ll burn during the duration for your flight. This allows FlightScale to give you your Ramp Weight, Takeoff Weight, Landing Weight, and of course Zero Fuel Weight with the CG for all of ‘em!
In the “Simple” template, you can define the Ramp Burn and Trip Burn on the right side under the “Advanced Parameters” tab.
For the “Advanced” template, you can specify a Ramp Burn and Trip Burn for each fuel tank entry on your template!
Currently, you enter Ramp Burn and Trip Burn in a volume unit such as gallons or liters. Your “Fuel Weight Per Volume” determines what the unit ultimately is so all of the inputs are uniform.
The Ramp weight will be shown on the plot with an “R” next to the square dot. Likewise, Takeoff weight with a “T”, Landing Weight with a “L”, and Zero fuel weight with a “Z”. If you set “Max Landing Weight” or similar parameters (in Adv. Parameters tab), the respective points will also be tested against these specified values. Otherwise they will only be tested against the defined envelope. If a point passes the tests, it will appear green along with the text at the bottom of the screen. If the point fails, it will appear red.
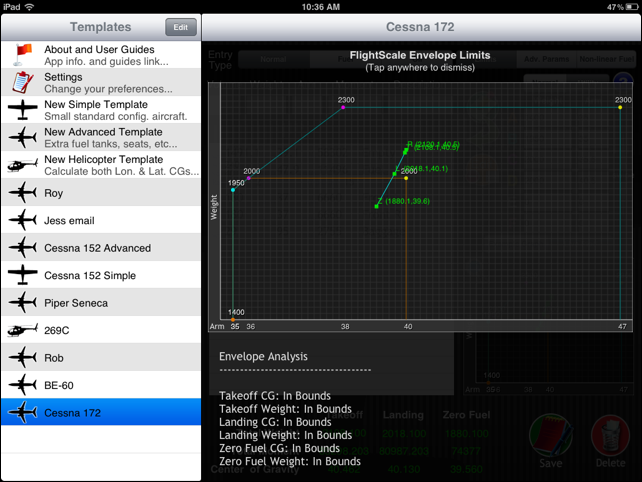
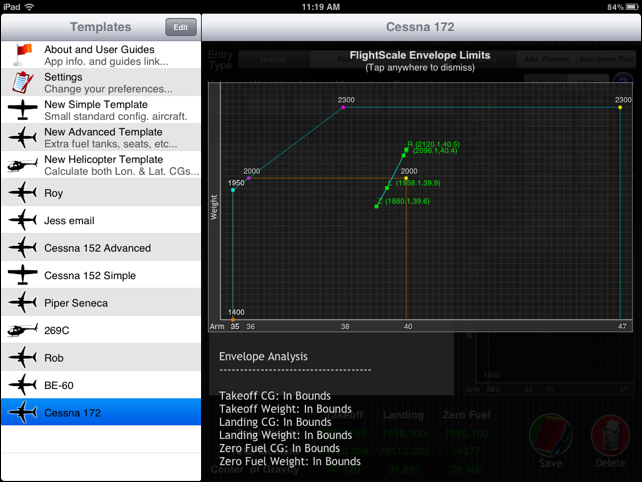
The screen shot below shows an expanded plot view with Ramp fuel (R), Takeoff fuel (T), the Landing Fuel (L), and the Zero Fuel (Z).
Section 8. Max Takeoff and Landing Weight
As of version 1.2.0 FlightScale allows you to define a maximum takeoff weight (Max T.O. Wt.) and maximum landing weight (Max Lnd. Wt.). These are limits that you can define for your aircraft, and each will place a red horizontal line on your plot graph. These entry fields are found under the “Adv. Params.” tab at the upper right corner of your template screen.
Your Full Fuel Weight will be tested against the defined Max. T.O. Wt. (if set) and the values for Full Fuel weight will display as red if it exceeds it.
Likewise, your Landing Weight will be tested against the defined Max Lnd. Wt. (if set) and the values for Landing Weight will display as red if it exceeds it.
The screenshot below shows an example of both the Max Takeoff Weight and Max Landing Weight set.
Section 9. Non-Linear Fuel CG
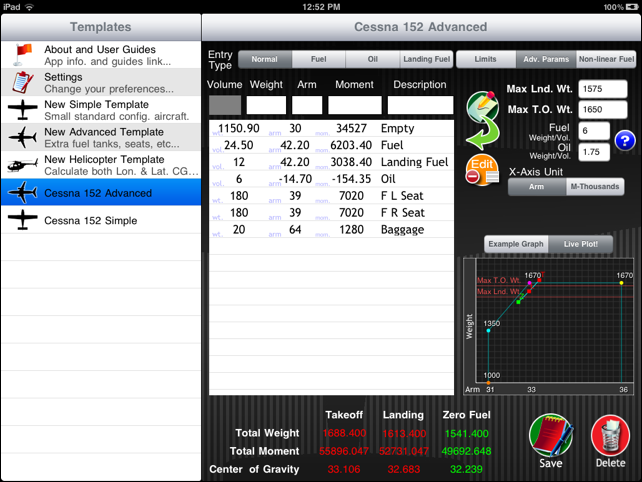
FlightScale v1.4 brought with it support for variable Fuel CG. This capability is only available on the Advanced or Helicopter Templates. For the example used in this section I will be using a Bell 206L4 Helicopter and a couple example pages from its POH.First, notice that on the top right of the screen (in an Advanced or Helicopter Template) there is an option called “Non-Linear Fuel”. Tapping this option will show you entry fields where you can add entries from the fuel CG table from the POH. Start your entries at 0 (zero) weight and increase with each entry. FlightScale at this time allows for 26 entries to be added from this table. It is important to note that not every entry from the table in the POH needs to be added. Points that fall in between other points in a straight line do not need to be added because FlightScale interprets these values automatically. For this reason it is easiest to enter points from the POH Fuel CG Graph. Below you will see an example table and graph from a POH.
The graph below shows points marked in red that would be good to add to the FlightScale Non-Linear Fuel CG table. These points represent where the graph trends change. Notice how there are far fewer points that need to be added than are offered in the table. More or less points can be used depending on how accurate you want the variable CG calculations to be. There is also an example graph with blue points marked that show how you can use only the extreme points to provide a decent estimate of the fuel burn CG. This allows us to enter only 5 points in to our Non-Linear Fuel table.
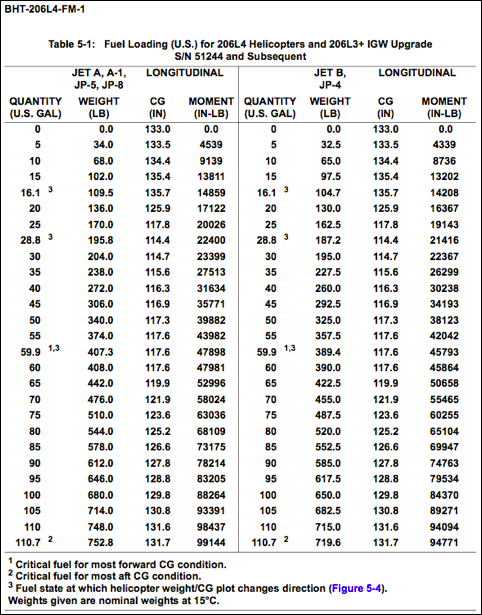
Non-linear Fuel CG Table from POH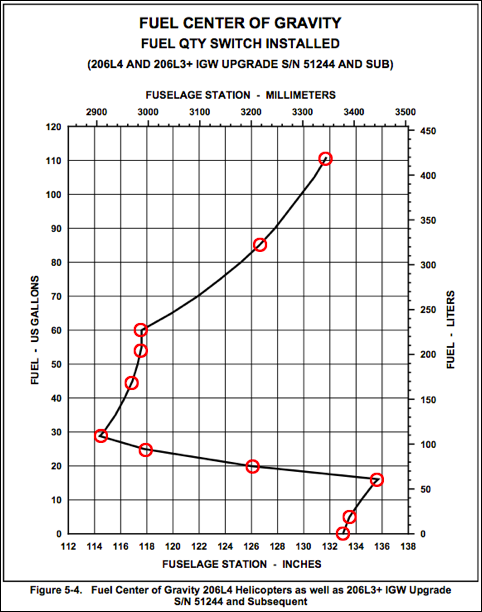
Non-linear Fuel CG Graph from POH with many points selected for high accuracy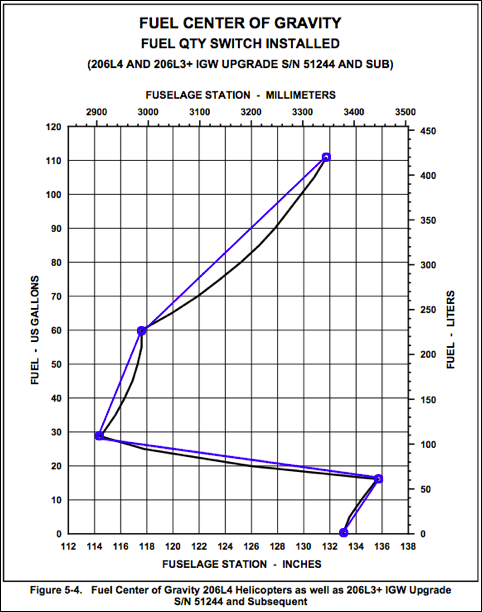
Non-linear Fuel CG Graph from POH with few points selected for a good estimate in accuracy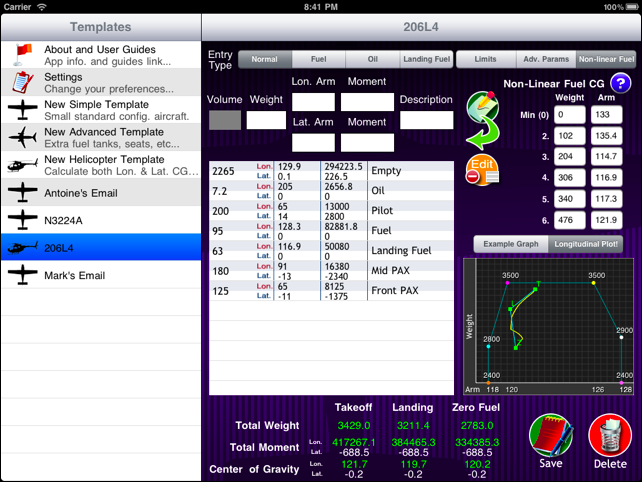
FlightScale v1.4 Showing Non-Linear Fuel CG on graph in yellow.
Once a Non-Linear Fuel CG table is defined in FlightScale the Longitudinal Arm will automatically be filled in when you are done editing a weight of volume field. Please note that the Lon. Arm. Field must be blank for it to automatically calculate your Arm from the Non-Linear Fuel CG table. If you have pre-existing entries please delete the Lon. Arm field. If you do not want the Arm calculated for a specific fuel tank you can define it manually and it will not be automatically overwritten.
Once your weight and arm entries, the envelope table, and the non-linear fuel CG table are filled in, you will see a yellow line on the graph between the Takeoff and Zero Fuel points. This yellow line represents how the CG of the aircraft really changes as fuel is consumed on your flight. You should see this line start at the Takeoff point, pass through the Landing point, and end at the Zero Fuel point. If your graph’s yellow line doesn’t pass through these points please make sure your fuel longitudinal Arm has been calculated from the non-linear fuel CG data. Do this by selecting the fuel entry and editing the Lon Arm field so that it is blank, and then tap in and then out of the weight field; this will trigger FlightScale to automatically calculate the Lon. Arm value for this entry.