Non-Linear Fuel CG coming!
December 07, 2010 22:55 Filed in: FlightScale | iPad
It has been awhile since I have updated this blog. Life has been quite busy lately and I’m hoping it will calm down a bit after the holidays.
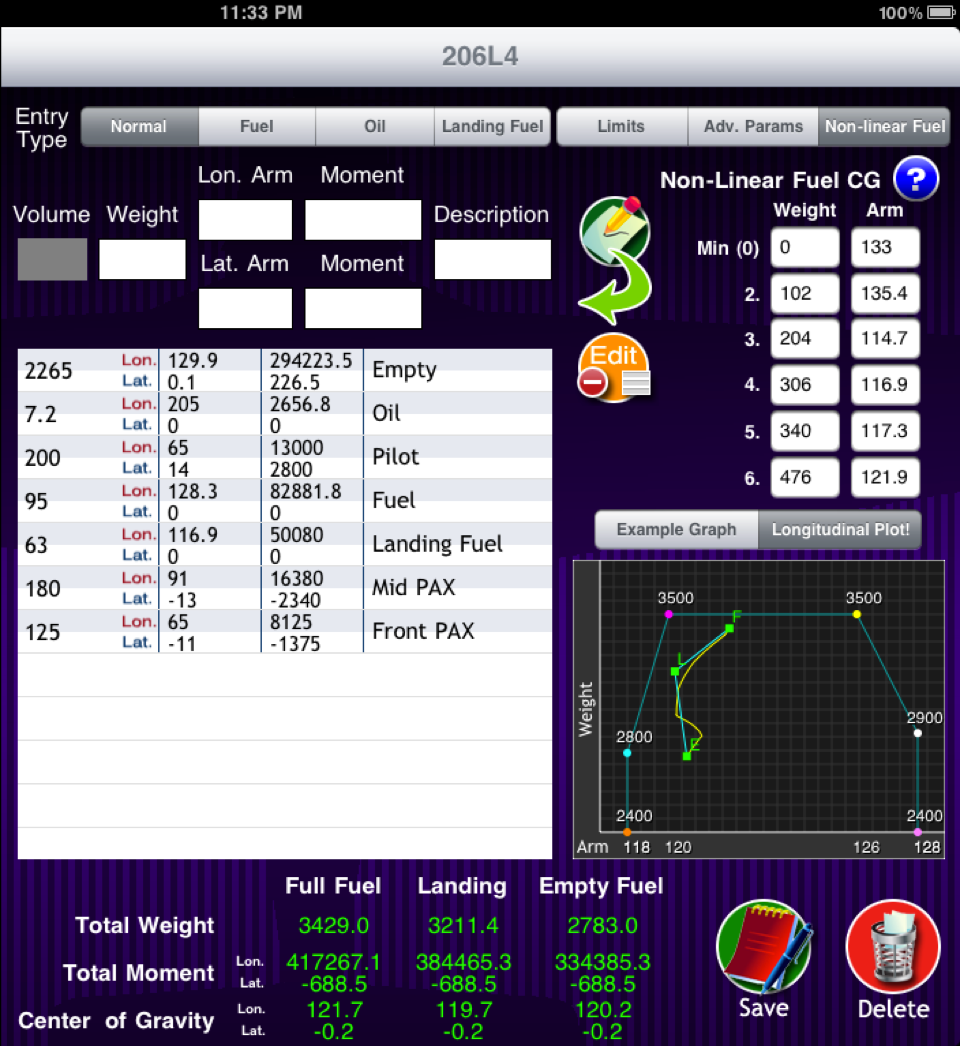
One thing that I have been working on that I wanted to share with you is support for Non-Linear Fuel CGs! This will allow you to enter the table of data from your POH for the fuel trends as the fuel weight changes, and FlightScale will now plot the CG changes for your fuel tank from full fuel down to empty! Also, when you enter a fuel weight (or landing fuel weight) it will look up the CG from the table and fill it in for you automatically.
It is important to note that these enhancements can only be applied to the longitudinal CG at this time.
A number of other improvements and interface tweaks are on the way soon. Stay tuned!
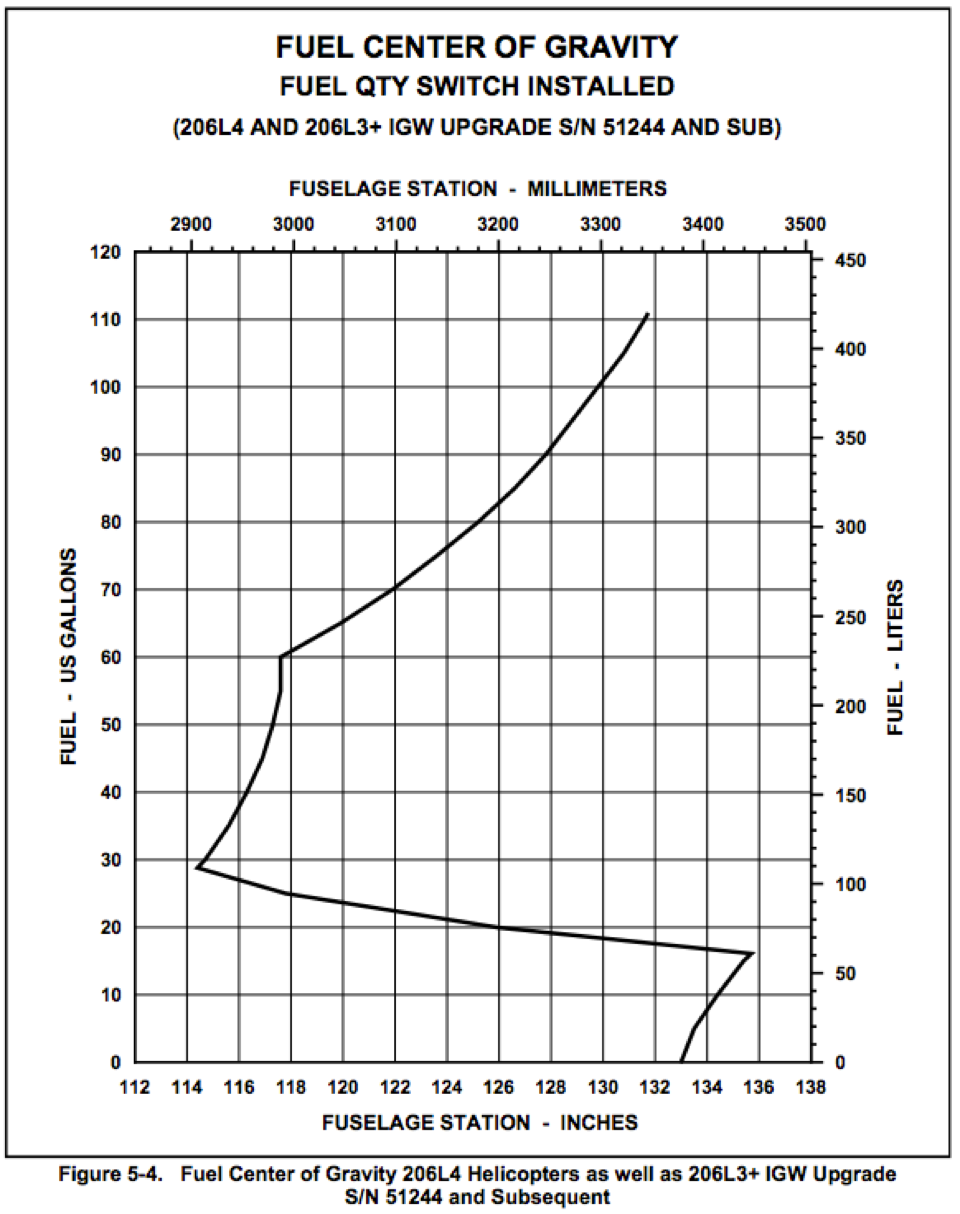
Below is a sample screenshot of FlightScale showing a plot using the new variable CG feature (note that the upper bounds of the envelope for the aircraft have been reduced to make relative plots larger). Compare the yellow line on the graph, which shows how the actual longitudinal CG varies with fuel consumption, with the graph of the Fuel Center from the POH for this aircraft. Notice the similar trend in the two graphs.

FlightScale v1.4 Screenshot showing Non-linear fuel CG

Fuel Center variable CG graph from POH
One thing that I have been working on that I wanted to share with you is support for Non-Linear Fuel CGs! This will allow you to enter the table of data from your POH for the fuel trends as the fuel weight changes, and FlightScale will now plot the CG changes for your fuel tank from full fuel down to empty! Also, when you enter a fuel weight (or landing fuel weight) it will look up the CG from the table and fill it in for you automatically.
It is important to note that these enhancements can only be applied to the longitudinal CG at this time.
A number of other improvements and interface tweaks are on the way soon. Stay tuned!
Below is a sample screenshot of FlightScale showing a plot using the new variable CG feature (note that the upper bounds of the envelope for the aircraft have been reduced to make relative plots larger). Compare the yellow line on the graph, which shows how the actual longitudinal CG varies with fuel consumption, with the graph of the Fuel Center from the POH for this aircraft. Notice the similar trend in the two graphs.

FlightScale v1.4 Screenshot showing Non-linear fuel CG

Fuel Center variable CG graph from POH
0 Comments

